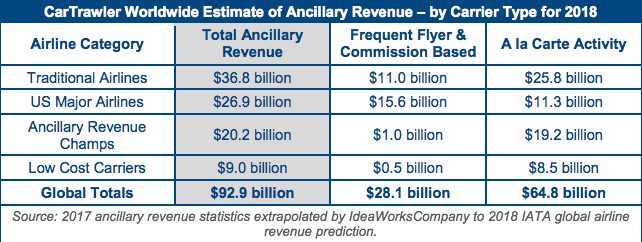
INTERNATIONAL. Airline ancillary revenue is expected to hit US$92.9 billion worldwide in 2018, a leap of +13% compared to 2017. That’s according to a report from airline revenue consultancy IdeaWorks Company and CarTrawler, a leading provider of online car rental distribution systems.
The CarTrawler Worldwide Estimate of Ancillary Revenue represents a +312% increase from the 2010 figure of US$22.6 billion, which was the first annual ancillary revenue estimate provided by the partners. The figures cover 175 airlines. Ancillary revenue includes commissions from hotel bookings, the sale of frequent flyer miles to partners, retail and F&B sales onboard and the provision of other services beyond ticket sales

Ancillary revenues are set to represent 10.7% of global airline revenue this year, compared to 10.6% in 2017, said the report. This figure was just 4.8% in 2010.
The report also noted: “IATA predicts more than 4.3 billion passengers will spend US$871 billion worldwide on air transport for 2018. Applying the global ancillary revenue estimate to IATA’s statistic yields a result of US$21.32 per passenger. IATA also estimates the airline industry will spend US$188 billion on fuel during 2018, which is up substantially from the 2017 level of US$149 billion. Ancillary revenue now equals almost half of the industry’s annual fuel bill. All those individual sales of seat assignments, checked bags and frequent flyer points provide a solid hedge against fuel prices.”
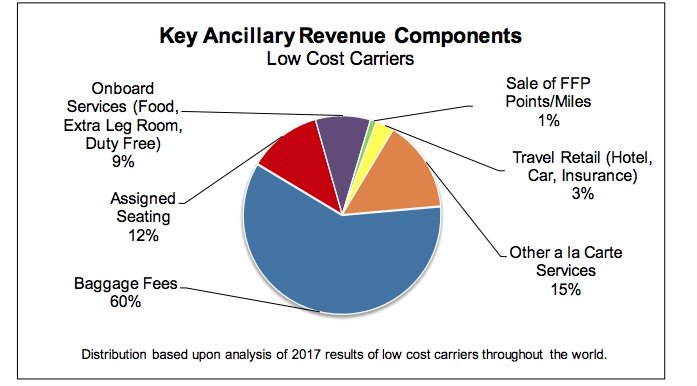
Low-cost carriers continue to drive growth in ancillary revenues. Within this segment, the report noted that 9% of this income (2017 figures) comes from onboard services that include duty free and F&B sales, along with fees for seats with extra leg room and other services.
The report segments airlines into four categories:
*Traditional Airlines: This represents the largest number of carriers. Ancillary revenue activity may consist of fees associated with excess or heavy bags, extra leg room seating, and partner activity for a frequent flyer programme. The average percentage of revenue for 2018 remains unchanged at 6.7% from last year. Ancillary revenue innovation among global network carriers in Africa, Asia, the Middle East, and South America remains “sluggish” when compared to Europe and North America, according to the report. Examples in the traditional airline category include Aerolineas Argentinas, Iberia, Japan Airlines, and Qatar Airways.
*Major US Airlines: US-based airlines generate strong ancillary revenue through a combination of frequent flyer mileage sales and baggage fees. The percentage of revenue for this group remains unchanged from last year at 14.2%. The lack of growth was largely due to a reduction in pre-payments made by Chase Bank to United for its co-branded credit card programme, said the report. Examples in this category include Alaska, Delta, and Southwest.
*Ancillary Revenue Champions: These carriers generate the highest activity as a percentage of operating revenue. The percentage of revenue achieved by this group jumped to 33.9% from 30.9% for 2017. The increase can be attributed to higher results from the big carriers in this category, and the addition of VivaAeroBus, Volotea, and WOW air to the list of disclosing carriers for 2018. Other examples in this category include: Allegiant, Pegasus, and Scoot.
*Low Cost Carriers: LCCs typically rely upon a mix of a la carte activity to generate good levels of ancillary revenue. The percentage of revenue for this group increased to 12.4% from 11.8% for 2017. Low cost carriers include Air Arabia, JetBlue, SpiceJet, and Transavia.
The report highlighted the performance of the last two categories in particular.
“These carriers are the originators of ancillary revenue, and have always effectively managed the combination of low fares and a la carte features. Whereas traditional airlines offer a handful of optional extras, the true ancillary revenue evangelists manage a buffet of choices in the online booking path, through mobile apps, and solicitations sent after travel is booked.”


