
INTERNATIONAL. The International Civil Aviation Organisation (ICAO) has outlined in stark terms the potential impact of the coronavirus on the Chinese aviation market for the first quarter of 2020.
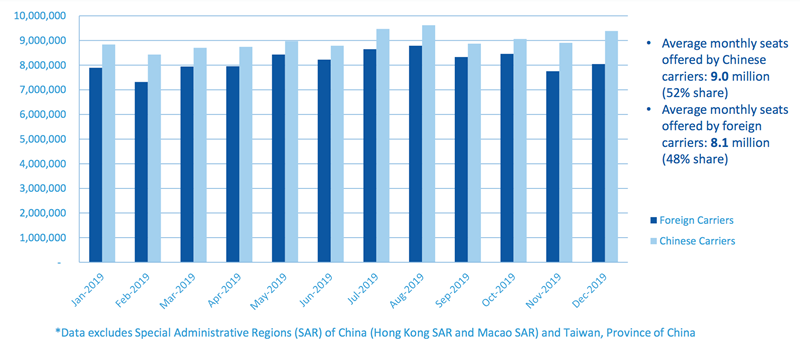
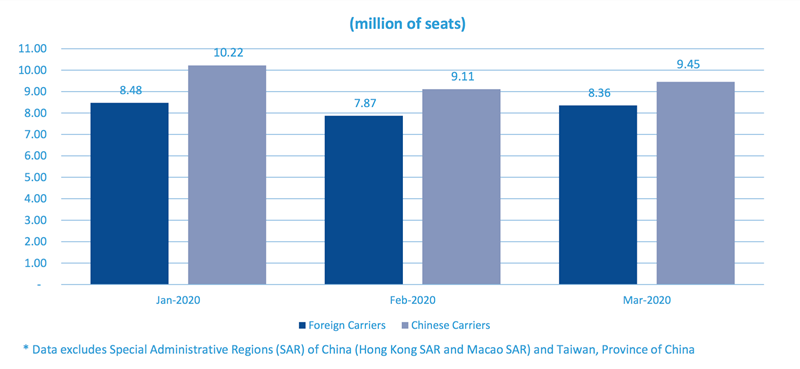
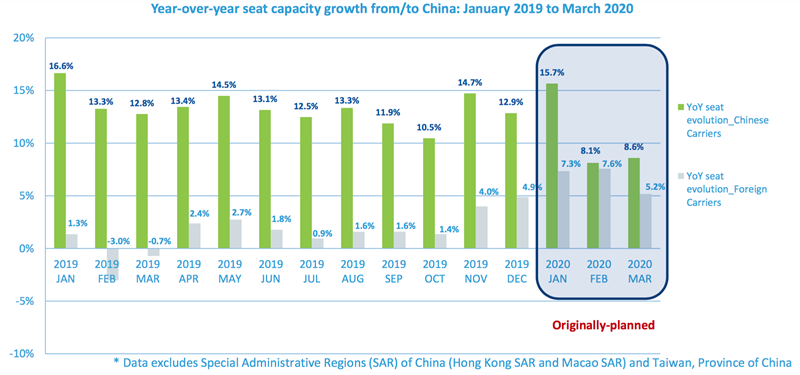
In January, February and March 2020, Chinese carriers were due to supply 10.22 million, 9.11 million and 9.45 million seats to and from China respectively (OAG data). These pre-coronavirus expected figures included increases of +15.7%, +8.1% and +8.6% year-on-year (excluding Hong Kong, Macau and Taiwan traffic).
Among foreign carriers, January, February and March forecasts were for 8.48 million, 7.87 million and 8.36 million international seats to and from Chinese airports, with growth projected of +7.3%, +7.6% and +5.2% respectively.
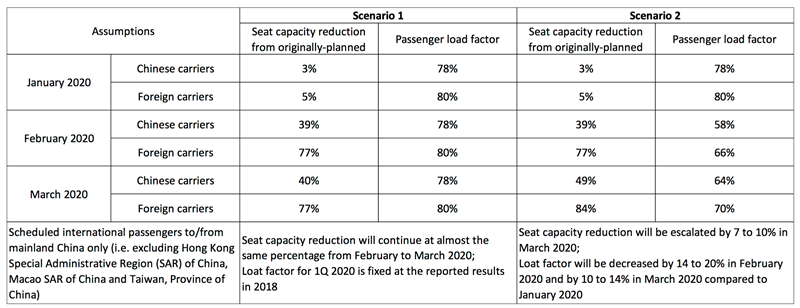
In a presentation for the ICAO Air Transport Committee on 7 February, the aviation body prepared two scenarios for Q1 2020 (using OAG numbers) based on trends since the coronavirus impact took hold.
One was based on a seat capacity reduction of the same percentage rate in February and March and a load factor for Q1 2020 fixed as per reported results from last year. The other (worse) scenario is based on seat capacity reduction escalating by 7-10% in March from February. Load factors under this scenario would decrease by -14% to -20% in February 2020 and by -10% to -14% in March compared to January.
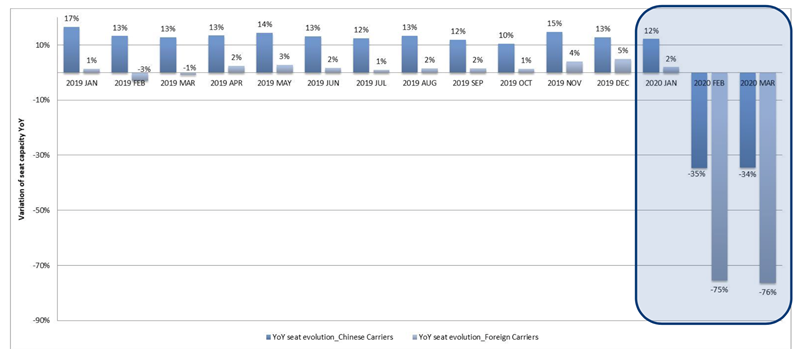
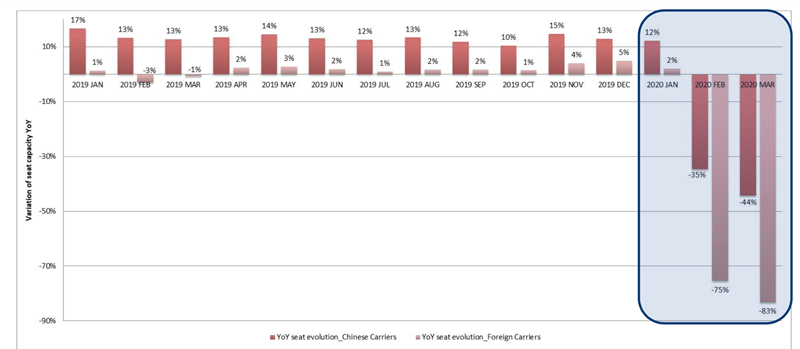
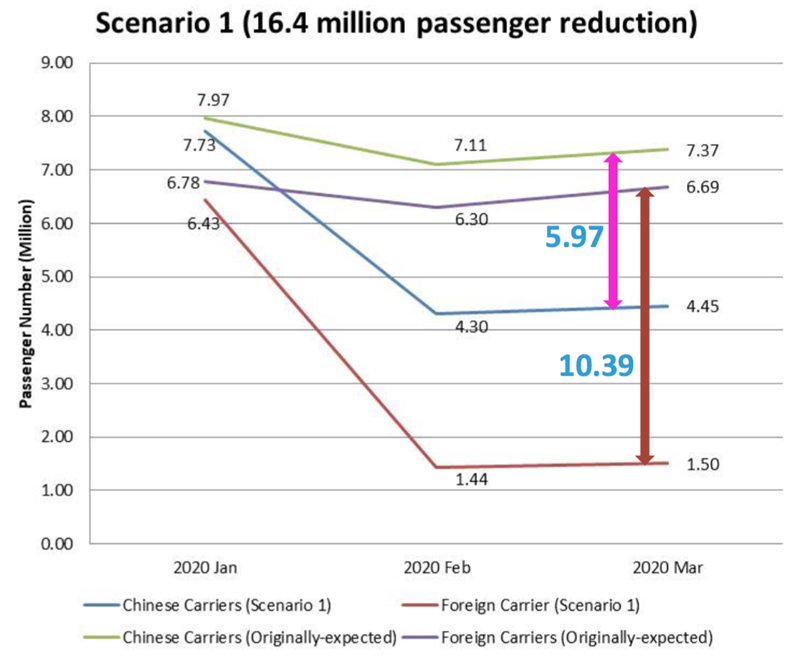
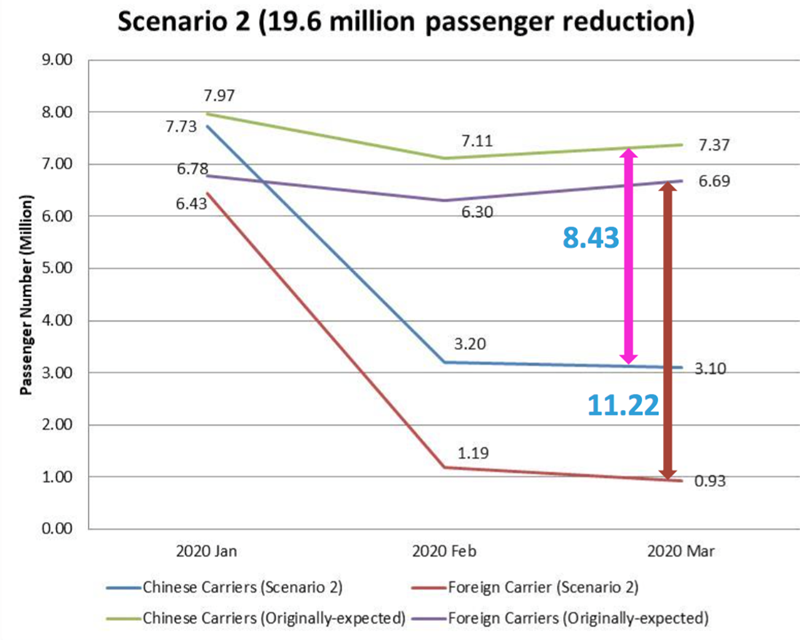
Under the first scenario, seat capacity among Chinese airlines could plummet by as much as -35% in February and March, and among foreign carriers by -75 to -76%. The fall could be even steeper under scenario two in both months, with Chinese airline seats down by a possible -35% in February and -44% in March, and among overseas airlines -75% in February and -83% in March.
In passenger traffic terms, this would mean a passenger traffic decline of 16.4 million from January through to the end of March (scenario one) and 19.6 million under scenario two (see charts above).
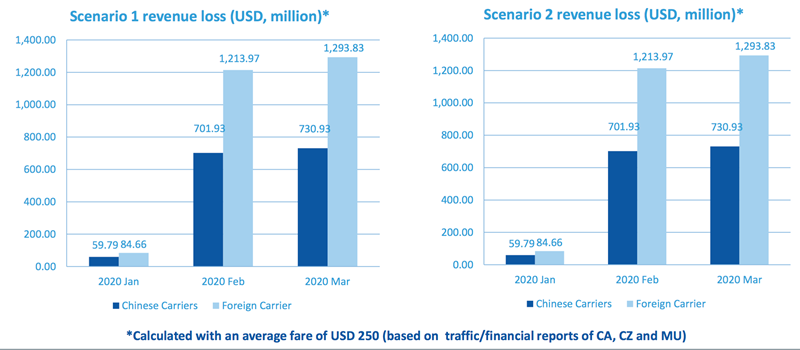
For the airlines, this in turn would mean revenue losses of US$4.1 billion to US$4.9 billion by the end of March, based on OAG data.
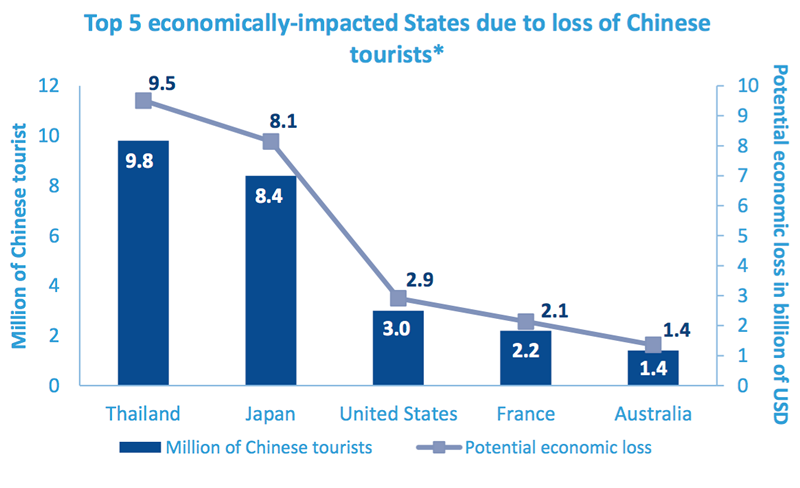

Using 2018 numbers as a base, ICAO also estimated the potential economic loss of Chinese tourism income due to the coronavirus. Thailand, it noted, could be hit to the tune of US$9.5 billion compared to 2018, Japan US$5.1 billion, USA US$2.9 billion, France US$2.1 billion and Australia US$1.4 billion.

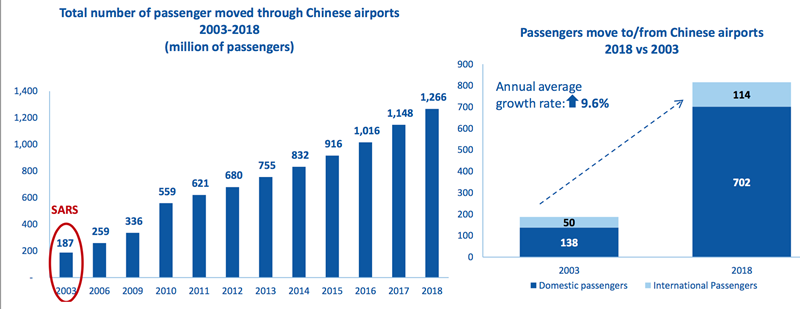
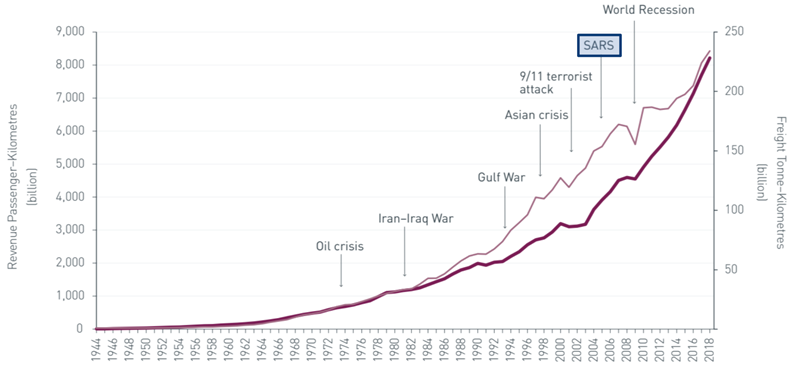
ICAO also noted how vulnerable air transport is to external shocks, including disease outbreaks. From the oil crisis of 1973 to the 1993 Gulf War and 1998 Asian financial crisis, through to SARS in 2003 and the global financial crisis (from 2008), the industry has been sharply affected in the short term but bounced back with sustained recovery on each occasion (see below).
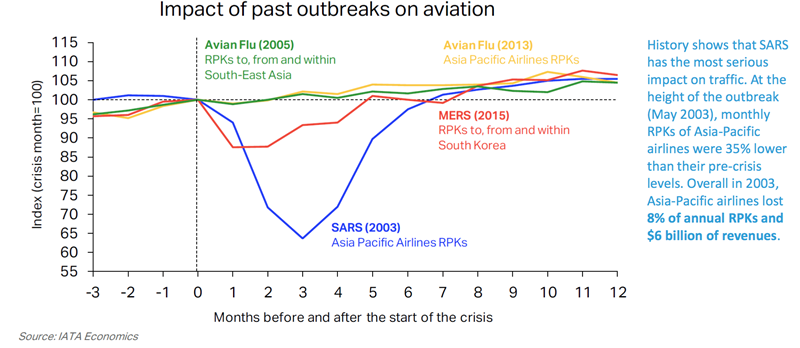
Of these, SARS had the biggest impact on air traffic (see lower chart below). At the height of the outbreak (May 2003), monthly revenue passenger kilometres (RPKs) of Asia Pacific airlines were -35% lower than their pre-crisis levels. Overall in 2003, Asia Pacific airlines lost 8% of annual RPKs and US$6 billion of revenues, said ICAO, reporting IATA figures. Avian Flu outbreaks in 2005 and 2013, as well as the MERS scare in 2015 had more moderate effects.
The organisation highlighted the fact that passenger volumes within, to and from China are far higher compared to 2003. From 2003 to 2018, the total number of passengers (domestic and international combined) leapt from 187 million to 1,266 million, at an average annual growth rate of +9.6%. Domestic passenger traffic in China climbed from 138 million to 702 million in the 15-year period, with international volumes rising from 50 million to 114 million (ICAO/ACI figures).