
INTERNATIONAL. Asia Pacific has reinforced its dominance of global air travel, accounting for nine of the world’s ten busiest airline routes in 2025, according to OAG’s latest annual analysis of airline capacity based on full-year scheduled seat data.
The Jeju-Seoul Gimpo corridor has once again emerged as the world’s busiest airline route, with 14.4 million scheduled seats in 2025. The short 243-nautical-mile route supports close to 39,000 daily seats and is served by seven airlines.
Capacity for the route is +1% ahead of 2024 but remains -17% below pre-pandemic levels, while OAG noted intense competition has pushed average one-way fares down -11% year-on-year to US$44.
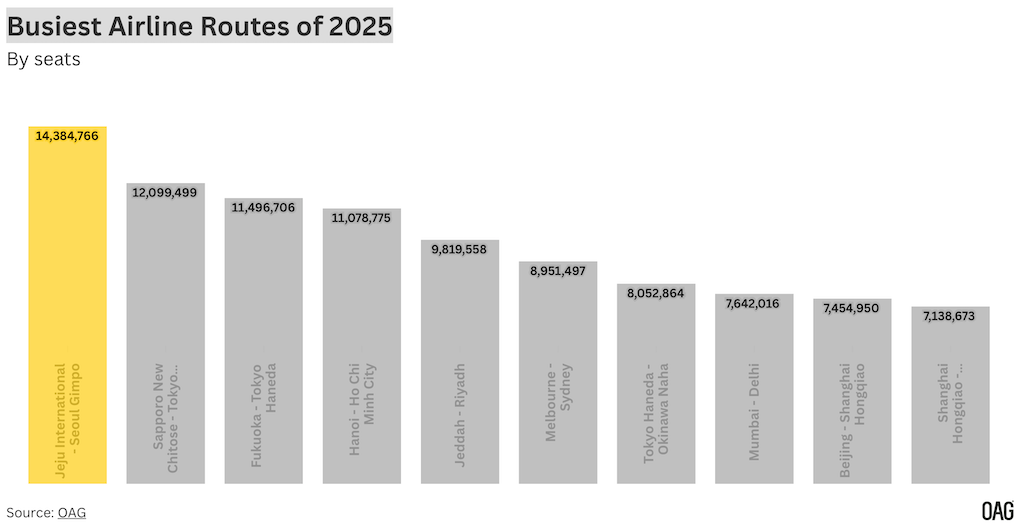
Japan continues to feature prominently in the busiest route list, despite its extensive high-speed rail network. Sapporo New Chitose-Tokyo Haneda ranks second globally with 12.1 million seats, up +1% year-on-year and just -3% below 2019 levels, signalling an almost complete recovery.
Fukuoka-Tokyo Haneda takes third place with 11.5 million seats, also up +1% year-on-year and now +1% above pre-pandemic capacity, making it one of the few major domestic routes globally to surpass 2019 volumes.
Vietnam’s main domestic trunk route between Hanoi and Ho Chi Minh City ranks fourth worldwide, with 11 million seats in 2025. Capacity was up +4% year-on-year and +8% above 2019 levels. Six airlines operate the route, where average one-way fares have declined -11% to US$67.
Saudi Arabia’s Jeddah-Riyadh corridor is the fastest-growing route within the global top ten and the only one outside Asia Pacific. Capacity has expanded +13% year-on-year to 9.8 million seats and now sits +22% above pre-pandemic levels, in line with broader domestic aviation growth in the Kingdom.
Average economy fares for the key Saudi route, however, have risen sharply, increasing +27% year-on-year to US$95.
Busiest cross-border airline routes
Hong Kong-Taipei retained its position as the world’s busiest cross-border route, with 6.8 million seats in 2025. Capacity is up marginally year-on-year but remains -14% below 2019 levels. Seven airlines operate the route, where average fares have declined -6% to US$115.
Cairo-Jeddah ranks second globally among international routes, supported by 5.8 million seats, up +5% year-on-year and an exceptional +71% above pre-pandemic levels.
Low-cost carriers now account for 43% of capacity and 81% of incremental growth for the route, underlining their role in driving demand. Nine airlines serve the route, with average fares down -12% to US$145.
Kuala Lumpur-Singapore is Asia’s second-largest cross-border route and third globally, operating 5.6 million seats in 2025. Capacity has returned to 2019 levels following +4% year-on-year growth. Served by seven airlines, it also records the lowest average fare among the global top ten at US$62, reflecting intense competition.
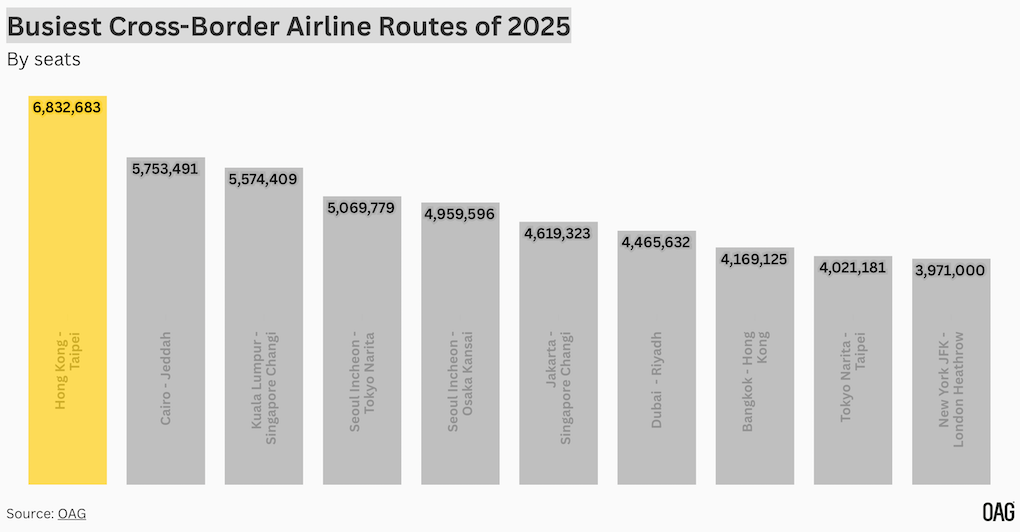
Japan-South Korea routes remain prominent. Incheon-Tokyo Narita ranks fourth globally with 5.1 million seats, while Incheon-Osaka Kansai follows closely with 5 million seats. Both routes operate well above pre-pandemic levels and are dominated by South Korean low-cost carriers, which account for the majority of capacity.
Jakarta-Singapore is the fastest-growing international route within the top ten, expanding +14% year-on-year to 4.6 million seats, though still -16% below 2019 levels. Dubai-Riyadh ranks seventh with 4.5 million seats, up +4% year-on-year and +42% above pre-pandemic levels.
The only transatlantic route in the global top ten is New York JFK-London Heathrow, operating 4 million seats in 2025. Capacity is marginally down year-on-year but remains +4% above 2019 levels. It also commands the highest average economy fare among the top ten at US$585.
Overall, seven of the ten busiest international routes in 2025 are in Asia, with the remaining capacity concentrated in the Middle East and the North Atlantic.
OAG’s data points to Asia and the Middle East as the principal engines of year-on-year capacity growth, underlining the continued shift in global aviation gravity towards these regions.
Busiest Chinese domestic routes
In China, Beijing-Shanghai Hongqiao remains the country’s busiest domestic route with 7.5 million seats, despite a -3% year-on-year decline and capacity still -8% below 2019.
Shanghai Hongqiao-Shenzhen follows with 7.1 million seats, up +4% year-on-year and now +14% above pre-pandemic levels. Guangzhou-Shanghai Hongqiao ranks third with 6.4 million seats, down -9% year-on-year and broadly back in line with 2019 volumes.
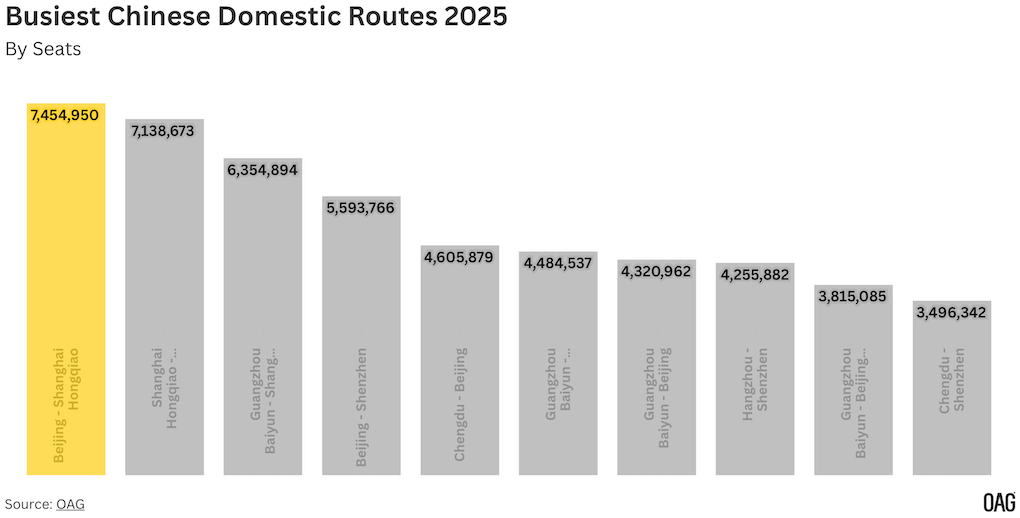
Several major north-south Chinese routes show stable performance. Beijing-Shenzhen operated 5.6 million seats, unchanged year-on-year but -11% below pre-pandemic levels, while Chengdu-Beijing held steady at 4.6 million seats, still -26% behind 2019.
Chengdu-Shenzhen recorded the largest year-on-year growth within China’s top ten, rising +12% to reach tenth place, although capacity remains -5% below pre-pandemic levels.
The continued shift of capacity from Beijing Capital to Beijing Daxing is evident, OAG noted, with Guangzhou-Beijing Daxing operating 3.8 million seats, well above 2019 levels, while Guangzhou-Beijing Capital remains -35% below pre-pandemic capacity.
Busiest US domestic routes
In the USA, New York JFK-Los Angeles is the busiest domestic route, with 3.4 million seats in 2025, up +9% year-on-year but still -20% below 2019 levels.
New York LaGuardia-Chicago O’Hare follows closely with 3.3 million seats, up +7% year-on-year, while Los Angeles-San Francisco ranks third with similar capacity but remains almost -30% below pre-pandemic levels.
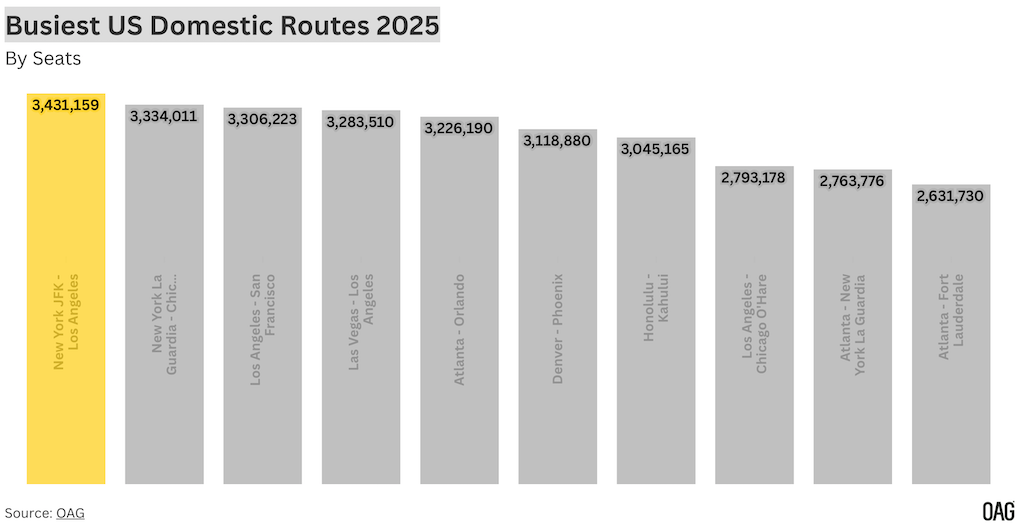
Denver-Phoenix stands out as one of the few US routes exceeding 2019 capacity, operating 3.1 million seats, +23% above pre-pandemic volumes.
By contrast, Honolulu-Kahului has slipped to seventh place, with capacity down -10% year-on-year. ✈