INTERNATIONAL. Luxottica Group has announced net sales of €1,464.7 million in the third quarter of 2010 – a growth of +19.7% (+8.6% at constant exchange rates) compared to the same period last year.
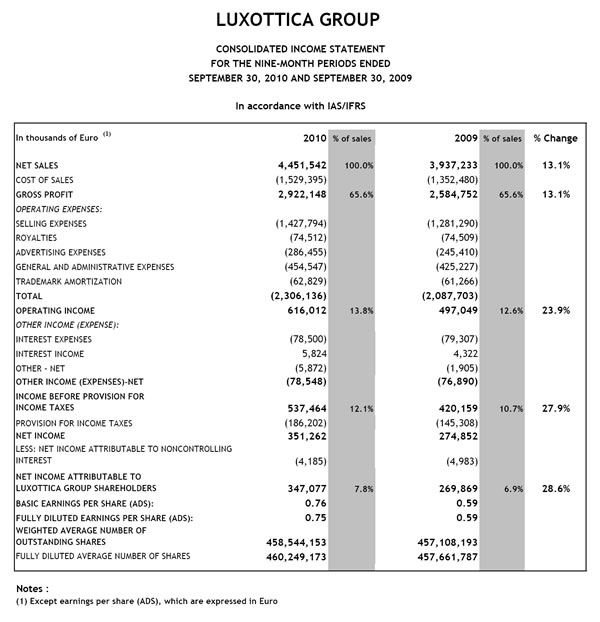
In the first nine months of 2010 (ended 30 September) net sales rose by +13.1% to €4,451.5 million, from €3,937.2 million in the first nine months of 2009.
EBITDA grew over the previous year by +25.6% to €263.5 million, from €209.8 million in the third quarter of 2009. In the first nine months EBITDA increased from €711.3 million in 2009 to €841.5 million (+18.3%) for the same period this year.
Net income for the third quarter of 2010 increased to €101.9 million (up by +34.5% from €75.8 million), resulting in earnings per share (EPS) of €0.22 (at an average Euro/Dollar exchange rate of 1.2910).
In the first nine months of the year net income amounted to €347.1 million, up +28.6% from the €269.9 million posted for the same period last year, resulting in EPS of €0.76 (at an average Euro/Dollar exchange rate of 1.3145).
 |
Click here to view the enlarged image (then hover over graphs with your cursor and click for full detail) |
Luxottica attributed the solid growth to the contributions of both its Retail and Wholesale divisions, the strength of its brands and the success of commercial initiatives in all the main geographic areas in which the group operates.
“Results achieved in the third quarter of 2010 were positive,” commented Luxottica Chief Executive Officer Andrea Guerra. “All our people were able to strongly react to and make the best of the opportunities offered by the New World in which we operate. Such results may be summarised in a solid growth in so-called mature markets – net sales in Europe were up by +12.7% and net sales in US dollars in North America rose by +8.5% over the third quarter last year – as well as in a strong increase in key emerging markets, where net sales grew by +26.2% over last year.
“Sun season results were positive all over the world and Sunglass Hut, our specialty sun stores chain, posted successful performances both in the US, where comparable store sales were up by +12.5%, and globally.
“Due attention must be given to the new growth trend of our premium and luxury brands: over the last two quarters, we have experienced a steady increase in the number of consumers again interested in these brands.
“The results achieved thus far allow us to look optimistically toward a year-end that, if we continue to work with the determination and passion shown in recent months, may allow us to reach the threshold of €400 million of net income.”
Overview of performance at the Retail Division
During the third quarter, the Retail Division’s solid results were boosted by positive performances at LensCrafters and Sunglass Hut. In particular, comparable store sales at LensCrafters were up by +8.4% for the third quarter of 2010 over the same period last year, thanks to the strong efforts of the entire organization and the solid trend of both “˜plano’ and prescription sunglass sales, as well as the positive results seen in sales during the back-to-school period.
Sunglass Hut also posted very positive results in terms of margins, with overall comparable store sales up +9.6% as compared to last year, with a very positive trend in the US (+12.5%).
On the other hand, comparable store sales were negative in Australia, where the retail market scenario is still challenging. In this market, the group is reacting with new initiatives aimed at increasing consumer traffic at the store level and at further improving the buying experience. Early results in the current quarter are positive.
Net sales for the Retail Division therefore rose to €946.5 million in the third quarter of 2010, from €793.8 million in the third quarter of 2009 (+19.2% at current exchange rates, +6.5% at constant exchange rates).
In the first nine months of 2010, net sales were €2,728.6 million, up +12.3% on the €2,430.8 million recorded for the first nine months of 2009 (+5.9% at constant exchange rates).
 |
Click here to view the enlarged image (then hover over graphs with your cursor and click for full detail) |