Welcome to the latest in a series of explainers on the acceleration of digital disruption in travel retail, by marketing, brand activation and customer experience specialist CircleSquare.
Continuing our series on the emerging travel retail strategic paradigm, the focus this month is on demonstrating both the opportunities and underlying complexity of travel retail by looking at three key aspects of the TR customer journey:
1) The TR digital & experiential shift
2) Trip Segment emphasis
3) Nationality mix by destination.
In our view these are vital areas to consider when planning sales focus & marketing investment in the channel.
The digital & experiential shift
Why invest at all? Last month we touched on the concept of TR’s traditional role as a “shop-window” for brands. One interesting effect of the pandemic has been that product discovery has become more important to consumers than price competitiveness, as m1nd-set’s February 2022 research release makes clear:

This is a consistent trend since the start of the pandemic. We would argue that covid-19 is a tipping point for travel retail, moving from being largely value-driven to an experience- and discovery-driven proposition.
Moving forward, brands that compete solely on promotion and value proposition will struggle, while those that invest in innovative online and offline experiential propositions are already starting to grow their market share both in terms of channel sales but increasingly by leveraging the first-party data acquired in TR to initiate local market sales and acquisition campaigns.
Trip Segment Emphasis
A critical consideration for brands with regards to TR distribution and marketing investment planning is at what point of the full TR journey do they have the greatest resonance with consumers.
The below graphic gives a general view of which trip segment has the highest commercial relevance to the main product categories in the channel. It is intended to be no more than indicative and reflective of the global TR footprint, there are of course considerable regional variations (e.g. APAC and the historic importance of downtowns).

Understanding where your brand is strongest along the classic travel retail trip segments is key to determining where to invest both in terms of physical disruptions (e.g. in-store/activations) and digital media.
For example, take a sunglasses brand: most purchases in this category are made by consumers looking for a new pair of shades to wear on holiday. Investment in awareness and conversion campaigns would naturally fall in the outbound segment.
Conversely, for wines & spirits, most purchases are made on the inbound segment as customers are looking to bring back a treat to enjoy at home.
This in turn impacts the digital media planning, as engaging consumers away from their home market frequently requires a different set of publishers to ensure they can be reached effectively and cost efficiently.
Nationality Mixes by Destination
The final area of complexity when considering travel retail campaigns is the traffic mix and the number of destinations included in the campaign.
Let’s take a look at April 2022 for three cities: Paris, London and Dubai. Shown are all the nationalities arriving in these cites that generated 80% of the traffic for the period in question.

How do you effectively target all or most of these nationalities who are on different platforms, exhibit differing browsing behaviours and ensure that the content is adapted to the differing nationalities in question? This is a significant challenge and there is no one-stop solution or data partner who can help you reach everyone.
At CircleSquare, we aggregate a mix of leading and specialist data partners from every region to synthesise destination-specific audience pools – which can be more or less relevant to the brand in question.
Initiating a global traveller campaign with accurate reach requires planning across multiple platforms. Take the Online Travel Agencies (OTA) platforms: these vary in popularity between each region and while North America and Europe are relatively homologous, the popularity of OTA platforms differs significantly between each region.

Astonishingly, booking.com – the largest OTA by market cap – enjoys only 5.74% of all travel-related worldwide web traffic[1], which points to the systemic fragmentation and extremely long-tail of the travel industry.
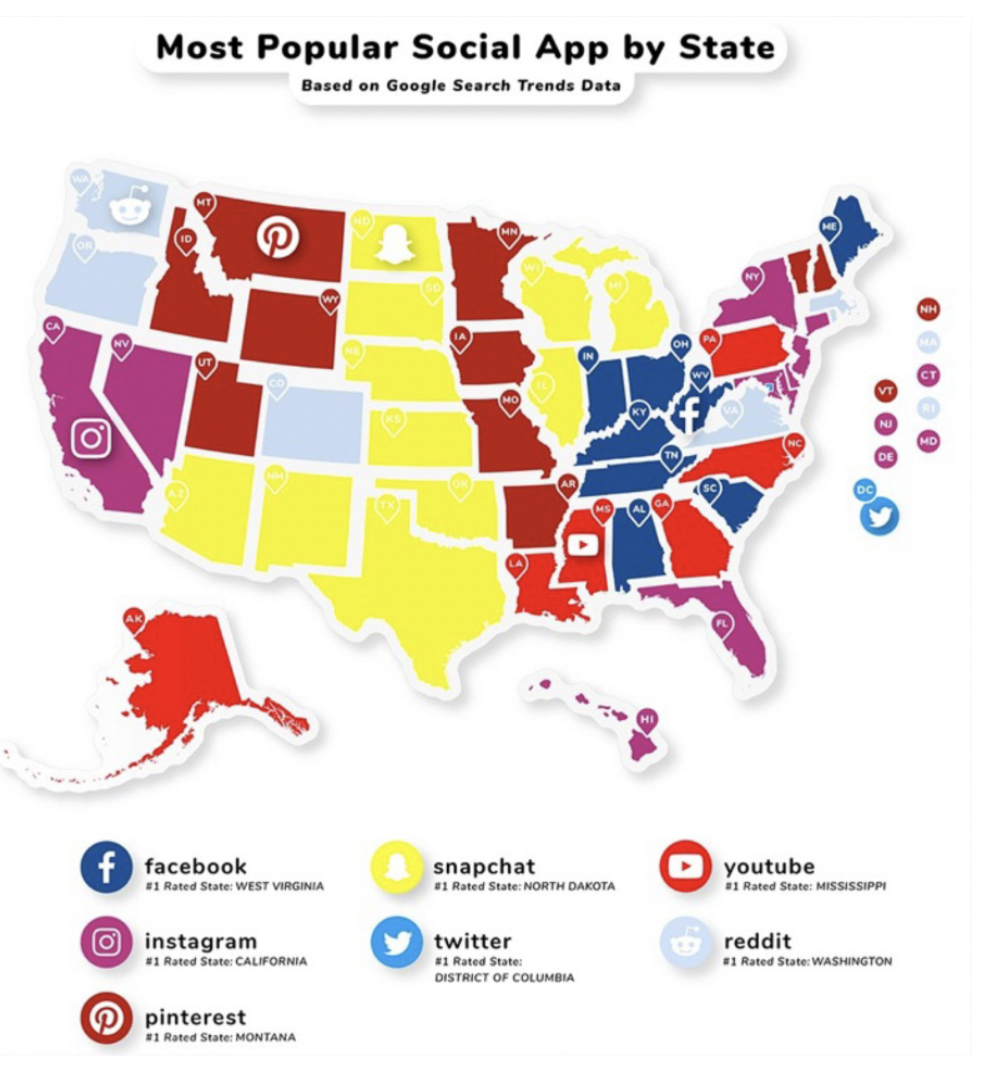
See one of our favourite publicly available graphics, showing the most popular social apps by state in the US in 2019 based on Similarweb and Google Search Trends data. Can you spot the App that didn’t feature then and is present today…?[2]
Most non-specialists assume that there is no significant regional variation in social app usage in the US, which is not the case. We find it fascinating that the region exhibits as much diversity as say, the Middle East or APAC.
So how do brands resolve these challenges? Primarily, they engage in data partnerships with specialist providers and make investments in establishing and growing their first-party data sets. Like many aspects of travel retail, the way this is leveraged in the channel is frequently counter-intuitive to how marketers and loyalty specialists go about leveraging these in local markets.
Well done if you have made it this far. We would love your feedback and to initiate a dialogue with you. You can reach us on this topic or any other here: getintouch@circle-square.com
[1] similarweb.com
[2] TikTok
*This article first appeared in The Moodie Davitt eZine. Click here for access.


