



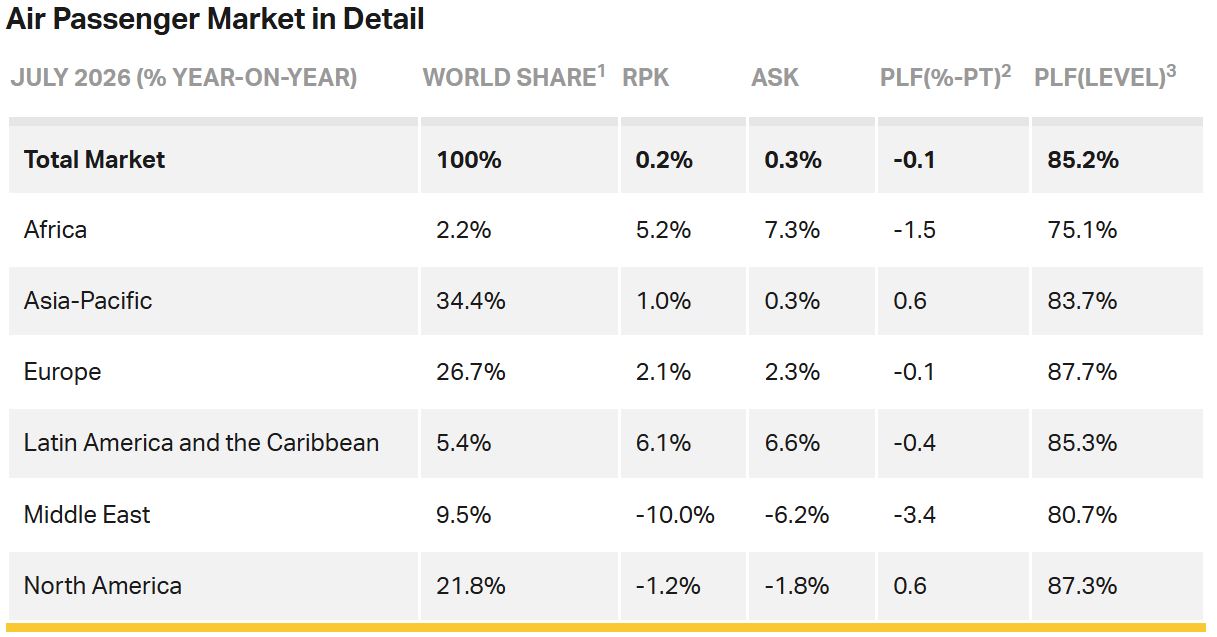
INTERNATIONAL. Global passenger traffic edged back into growth in July, ending three consecutive months of decline attributed to the Middle East conflict, according to the International Air Transport Association (IATA).

Measured in revenue passenger kilometres (RPKs), total demand increased +0.2% year-on-year, rising +1.2% when the Middle East is excluded. Capacity, measured in available seat kilometres (ASKs), grew +0.3%, while the global passenger load factor stood at 85.2%.
Asia Pacific was the strongest-performing region, with carriers returning to growth after two months of decline. North American airlines, by contrast, continued to see softer travel demand.
IATA Senior Vice President Sustainability, and Chief Economist Marie Owens Thomsen said, “The peak Northern summer travel season is a mostly positive story for air travel.
“Overall growth of +0.2% in July was achieved despite year-on-year collective declines by carriers in North America and the Middle East. Notably, traffic through the Gulf hubs continues its recovery trajectory.
“Although high fuel costs, economic uncertainty and geopolitical tensions continue, carriers are expressing confidence in demand for the last part of the year with an almost +3% expansion of seat capacity in September.”
International traffic performance by region
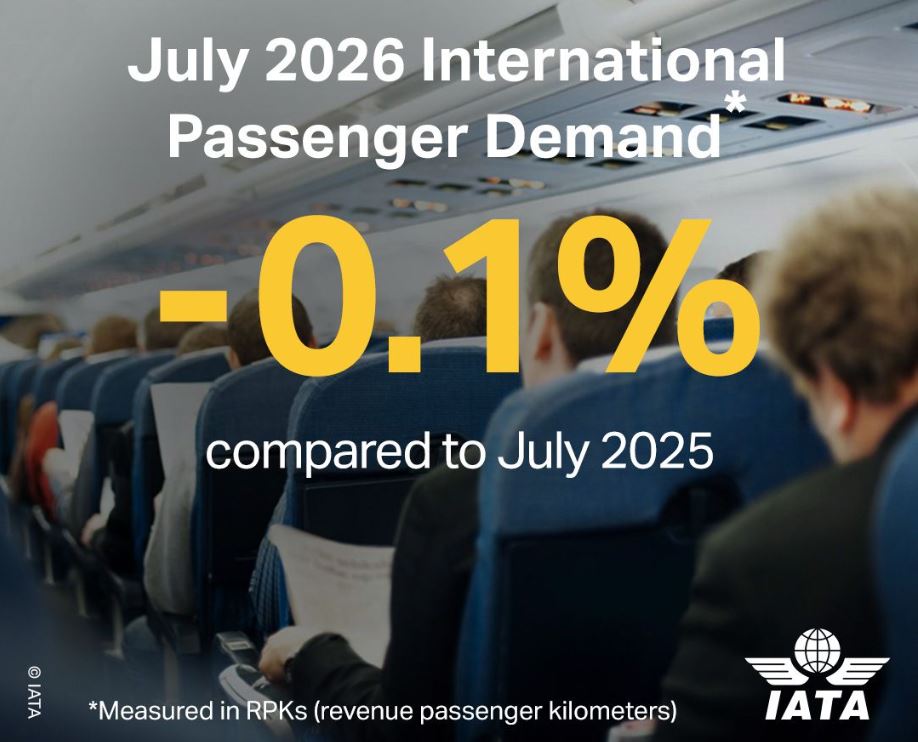
International passenger traffic showed signs of recovery in July, with demand down just -0.1% year-on-year, an improvement on the -0.6% decline recorded in June.
Excluding Middle Eastern carriers, international traffic grew +1.5%. Capacity also returned to growth, rising +0.3% after four consecutive months of decline. The international passenger load factor, however, slipped 0.3 percentage points year-on-year to 85.2%.
Demand among Asia Pacific airlines declined -0.7% year-on-year in July, while capacity fell -1.7%. The passenger load factor reached 84.5%, up 0.9 percentage points from July 2025.
European airlines continued to see healthy demand during the month, with traffic up +3.1%, as capacity rose +3.2%. The passenger load factor eased 0.1 percentage points to 87.1%.
Europe-Asia traffic was the standout performer, surging +12.1% and posting the strongest growth among major international corridors.
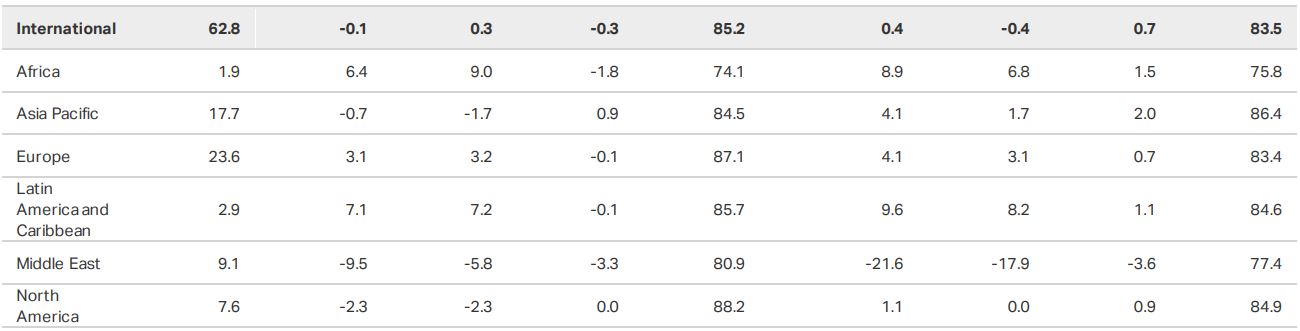
North American carriers remained under pressure in July, with demand declining -2.3% year-on-year as capacity fell at the same rate. The passenger load factor remained unchanged at 88.2%.
Traffic across the transatlantic corridor fell -2.2%, with notable declines involving the UK, France and Spain.
Middle Eastern airlines continued to face weaker international demand during the month, with passenger traffic down -9.5% and capacity declining -5.8%. The passenger load factor fell 3.3 percentage points to 80.9%.
Despite the sharp decline, the contraction in traffic continued to moderate from the double-digit falls recorded earlier in the year.
Airlines in Latin America and the Caribbean led all regions in international traffic growth, with demand rising +7.1%. Capacity climbed +7.2%, while the passenger load factor stood at 85.7%, down 0.1 percentage points from the same month in the previous year.
Demand for air travel across Africa rose +6.4%, while capacity climbed +9%. The passenger load factor eased 1.8 percentage points to 74.1%.
Domestic demand drives recovery
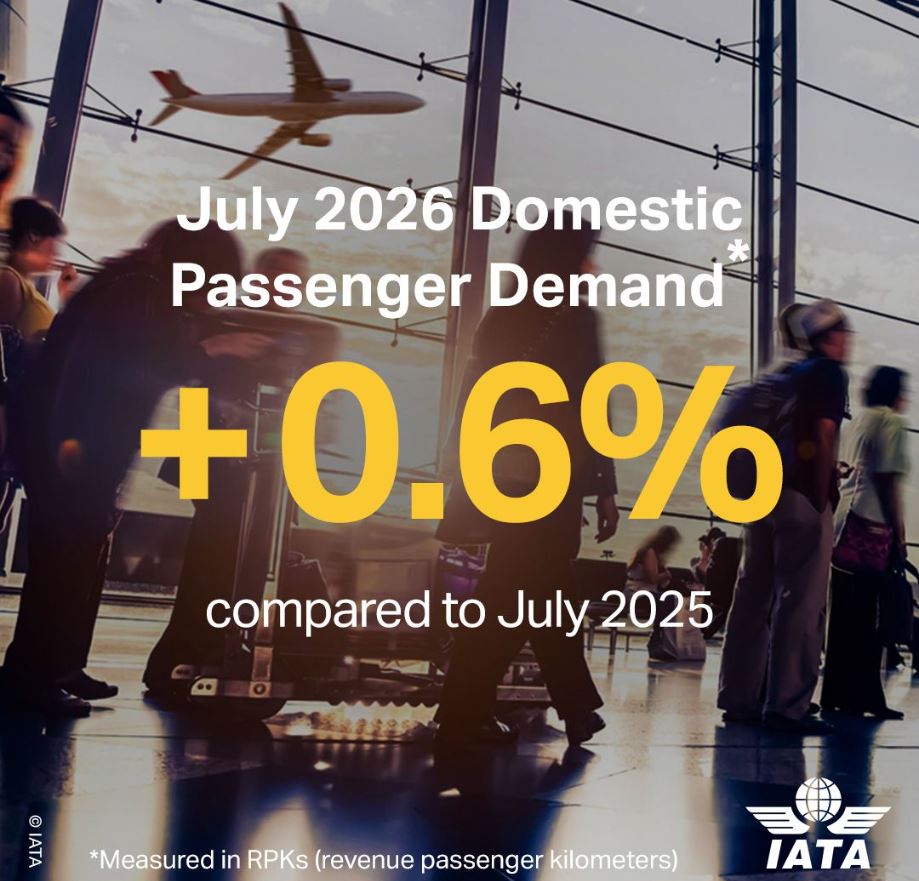
Domestic markets rebounded in July, returning to growth after two months of contraction, led by the recovery in China.
Capacity rose +4.7%, slightly below demand growth, lifting the domestic passenger load factor by 0.5 percentage points to 83.6%.
Brazil was the strongest-performing major domestic market, with RPKs increasing +6% year-on-year. Capacity grew at a faster pace, rising +8% and pushing the passenger load factor down 1.5 percentage points to 84.1%.
Japan’s domestic market also rebounded in July, with demand up +0.9% year-on-year after declining in June. Capacity increased +0.4%, pushing the passenger load factor up 0.4 percentage points to 81.8%.
US domestic demand fell -0.5% year-on-year, extending the decline to a third consecutive month. With capacity down -1.4%, the passenger load factor increased 0.8 percentage points to 86.7%, the highest of the major domestic markets.
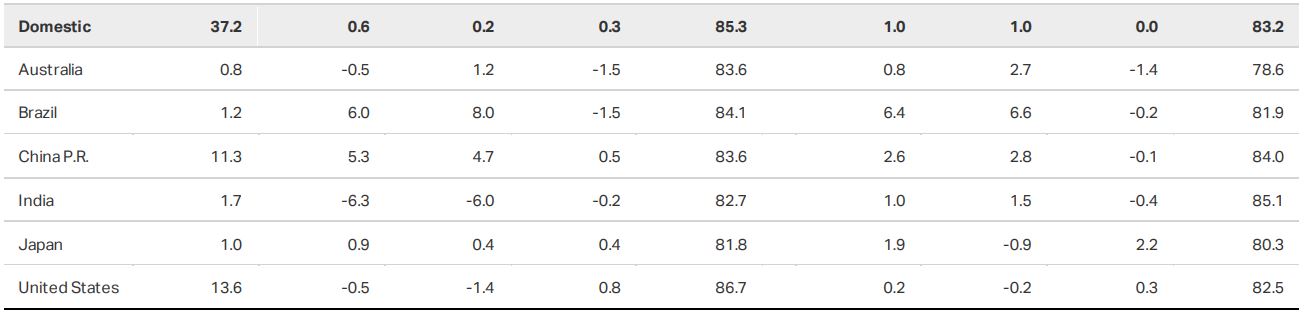
Australia also recorded a -0.5% year-on-year decline in domestic demand. Capacity rose +1.2%, outpacing demand and reducing the passenger load factor by 1.5 percentage points to 83.6%.
India posted the sharpest decline among major domestic markets, with traffic falling -6.3% year-on-year in July, following a deeper decline in June. Capacity dropped -6%, broadly in line with demand, and the passenger load factor edged down 0.2 percentage points to 82.7%.
IATA forecasts a further build-up in global scheduled seat capacity, with growth expected to accelerate from +1.2% year-on-year in July to +1.9% in August and +2.9% in September.
The Middle East is set for a gradual recovery, with capacity declines projected to moderate to -5.4% and -3.8%, respectively. Asia Pacific is also expected to gain momentum, with capacity growth reaching +1.1% in August and +3.4% in September. ✈